The Slow Requests Weren’t My Code. I Just Couldn’t See the Network Locally
What my internship taught me about production, Grafana, and a public address that sent traffic the long way round

Everything worked on my machine. Then the project went to production, and I found out how much I hadn't been able to see.
A set of requests was slow. My first thought was that my code was at fault. It wasn't. The cause was how two parts of the project were connected, and I only found it because I finally had a dashboard to look at.
This is the third post about my internship. The first was about what the internship taught me. The second was about my Claude Code side quest. This one is about the moment my work stopped being "does it run" and became "how does it behave". I can't share project details because of my NDA, so this is only about what I learned.
Local only shows you the shape of the deployment
As developers, we say "it works" when it works locally. But locally there is no real network between the parts, and nothing is deployed separately. So you can't know what will happen once the parts live in different places.
That was my biggest shift. What I see locally is the shape of the deployment. The real behavior only appears in production.
Runtime and build time
The first thing I had to learn properly was env variables, and especially which ones are needed at build time and which at runtime.
Some values are used while the image is being built. Others are only read when the app is running. If you hand a project to the people who deploy it and don't say which is which, they have to guess. A wrong guess means a broken or misconfigured deploy.
Writing this down helped them deploy properly. It also helped me, because I had to understand my own project well enough to explain it.
My first Grafana dashboard
On my first deployed project, I was given access to Grafana. I didn't understand most of what it showed. I knew what some things meant, but p95 and a lot of the other panels were out of my depth.
So I treated it like any other thing I needed to learn. These are the three things I started with:
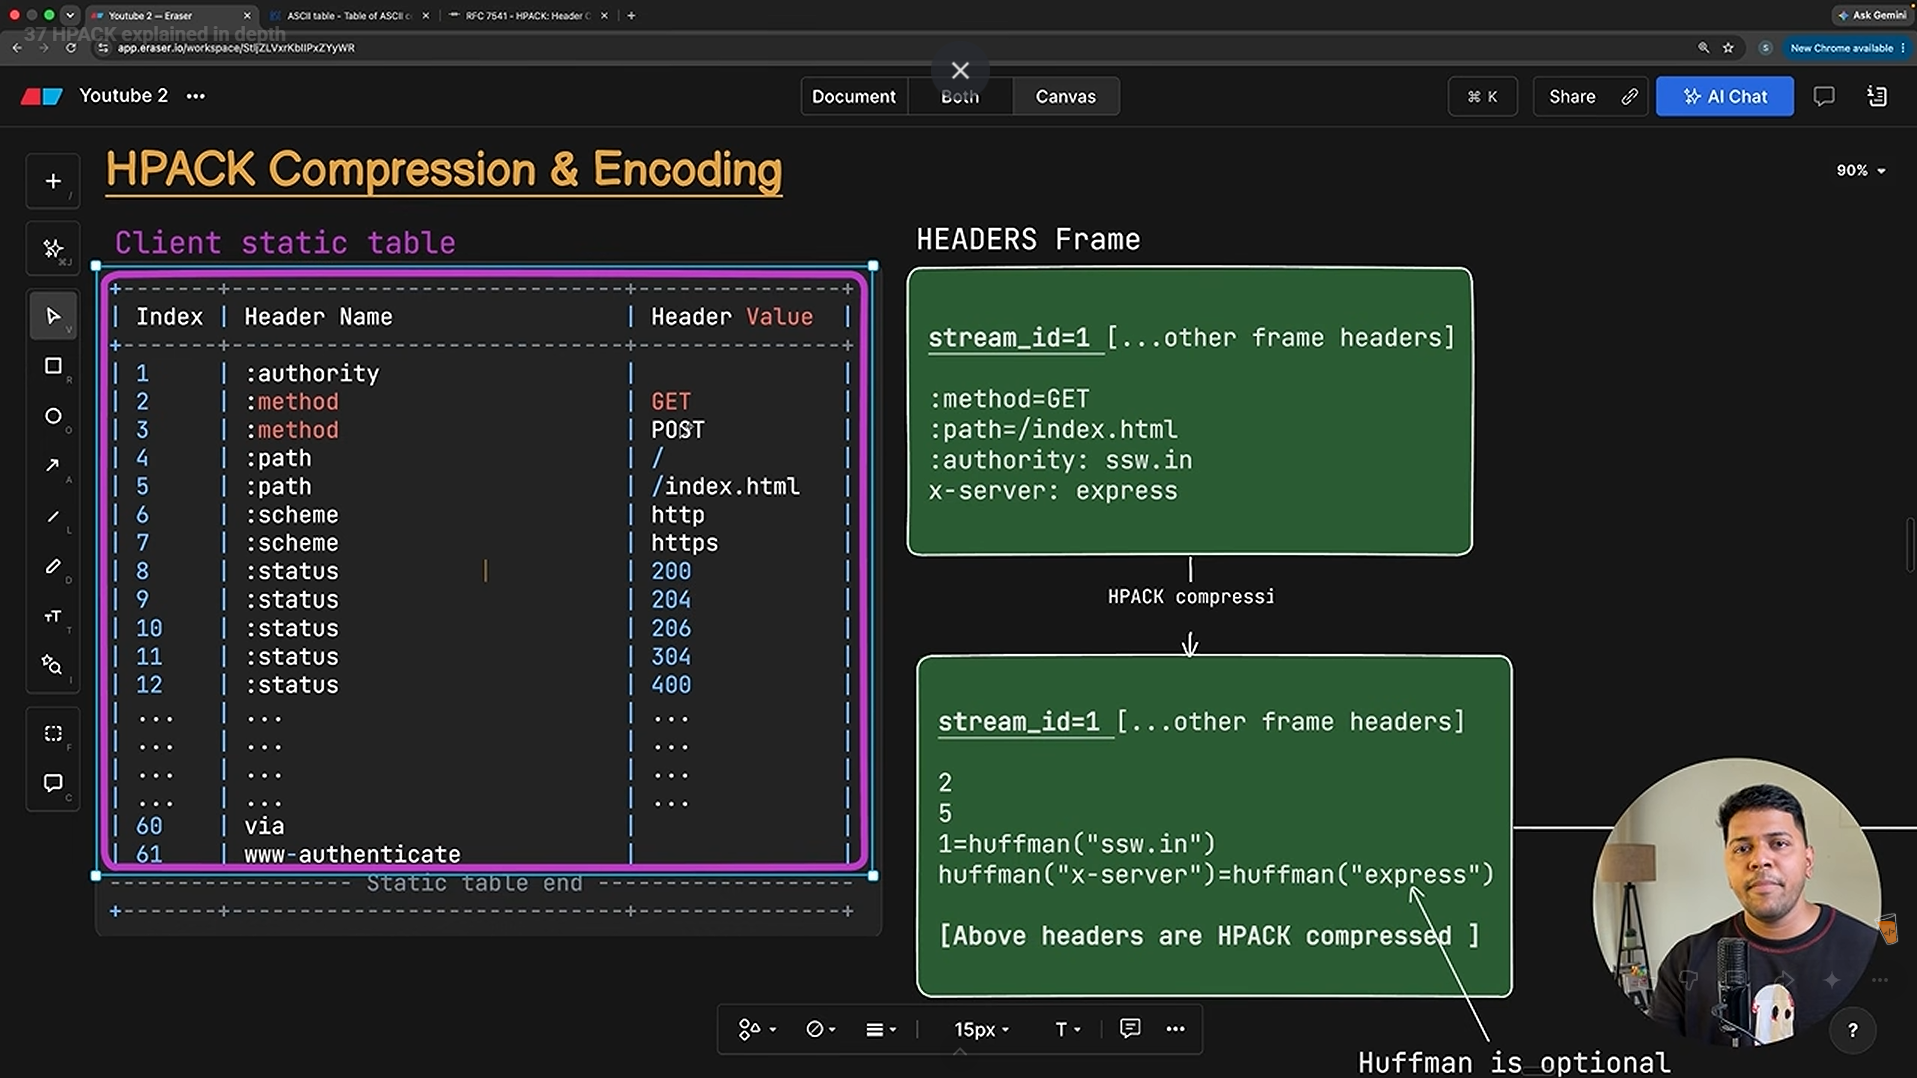
- Grafana Tutorial for Beginners (Tech With Diego) covers data sources, dashboards, panels, and the basics of observability.
- Grafana & Prometheus: Create a Complete Dashboard (Rayan Slim) was the most useful for my work. It covers request counts, error rates, duration, throughput, latency percentiles, CPU and memory.
- Prometheus and Grafana, the official tutorial shows how metrics are collected and then visualized.
The number worth explaining is p95. It means 95% of requests were faster than this value, and the slowest 5% were slower. An average can look fine while a slow tail hurts real users. p95 shows that tail.
The reason I wanted to learn this is simple. The project had started to move, and the dev team's setup only showed logs. Logs tell you what happened. They don't tell you whether requests are slow, or why. So I used the free public dashboards that already exist and worked out which panels I actually needed for my project.
I'm still early. It's the fun part, but I won't pretend I've seen how far observability goes.
The slow requests
On the dashboard, I saw slow requests. My first guess was my own code. It wasn't.
The project is a monolith, but it's deployed as separate images: one for the web and one for the API. The problem was how they were connected. In the web image, I had given the API's public address.
So every API call from the web left the cluster, made a round trip over the public network, and came back in. The response did the same.
What I had:
  web ──> public internet ──> API
  web <── public internet <── API
  (out of the cluster and back, twice per request)

What it should be:
  web ──> API
  web <── API
  (inside the cluster)
Two services sitting next to each other were talking through the front door. The fix is to connect them using the internal address, so the traffic stays inside the cluster.
I couldn't have found this by reading code. It only showed up in the numbers.
What I'd check next
I want to be careful here.
- I haven't run a controlled before and after, so I can't tell you how much faster it got, and I won't make up a number.
- Public-address traffic is the likely cause, not the only possible one. I want to confirm it by watching p95 before and after the change on the same traffic.
- I'm still learning which panels matter. I may be reading some of them wrong.
What I take from this
- Local tells you the shape. Production tells you the truth. Some problems only exist once the parts are deployed apart.
- Slow doesn't always mean bad code. Here it was a configuration choice. It wasn't an architecture problem either, and nothing needed a redesign. I only needed to see where the fault was.
- Observability matters most after the project ships. Before that you're building. After that you're watching, and you can only fix what you can see.
Two other things I did
I started studying disaster recovery, beginning with this video on RTO, RPO and failover. I'm at the beginning of it.
I also made a skill that tracks my daily work log. It records what I did and why, so I can document my work without relying on my memory at the end of the week.
About the author
- I’m a curious learner and aspiring software developer who enjoys building real-world systems, exploring new technologies, and learning in public. I write about coding, personal growth, and turning ideas into practical systems—while simplifying complex concepts for others.
Comments
Join the discussionNo comments yet. Be the first to comment.